
Electricity Usage Monitor
I use a lot of electricity in my home. With all of these computers running, as well as inefficient halogen lighting, the place is kinda a drain. But how can you reduce your usage if you don't know what to reduce? That's why I decided to build a device that can track my power usage to the minute, as well as give me instant statistics on what it's costing me.Tracking Usage
There's all sorts of expensive ways you can track your electricity usage, starting at $150 and going up from there. I aimed to spend a lot less money.My electricity utility had recently changed my old-school spinning-disc meter out for a 'Smart Meter'. While this may sound kind of them, in reality they only did it so they can charge me more money in a system called "peak hours", where the cost of electricity goes up during the day, but at night the price is the same as before the "peak system". So essentially, it's a way to guarantee people's bills to increase.
Anyway, the specific meter I got was a 'REX' meter by Elster, a very common network meter. This meter has a very useful feature -- located on the front of the meter is a small port. Inside the port is an infrared LED. This LED flashes once every time you use exactly one watt-hour of electricity. Electricity is billed in kiloWatt-hours (kWh), so the LED will flash 1000 times for one 1 kWh to be consumed.
The advantage to monitoring your power consumption directly from the meter is that your calculations will exactly match what you are billed for. Other metering systems might not be as accurate.
The Hardware
With help from a friend, I selected a small infrared phototransistor and built an extremely simple circuit with an Arduino: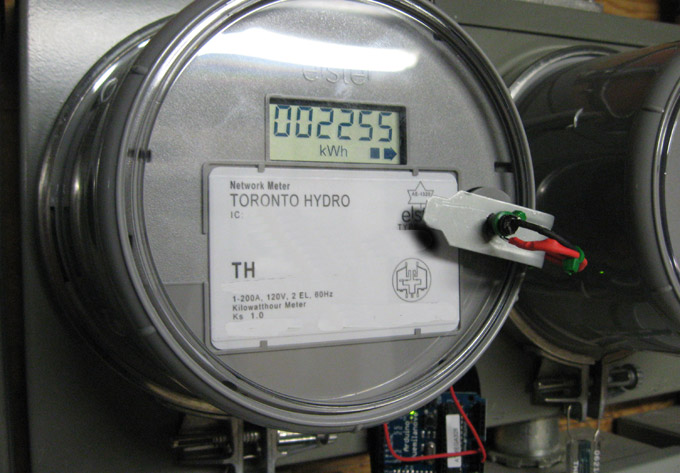
As you can see, only three wires are connected to the Arduino:
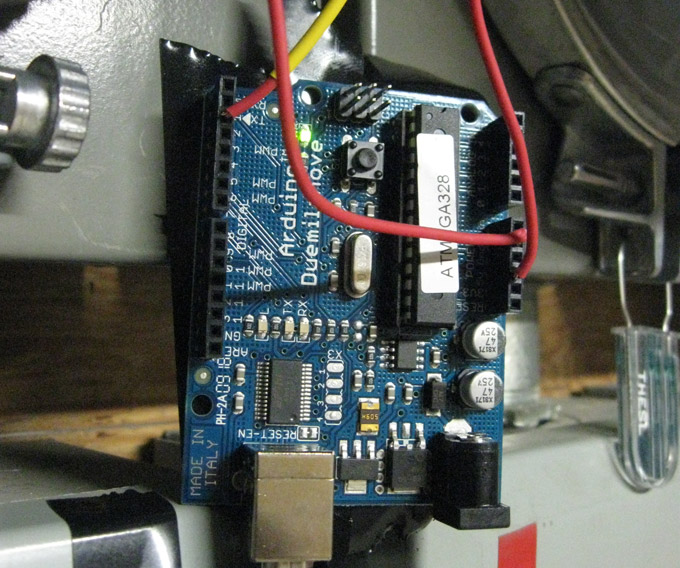 To avoid angering my electricity utility, I attached everything using only tape. Thanks to the convenience of the infrared LED light, there is nothing directly connected or permanently mounted to the meter in any way.
This arduino is wired into a small, low-power PC running special software that logs and tracks the data coming out of the Arduino.
The Software
This simple program tracks and logs the data coming out of the Arduino: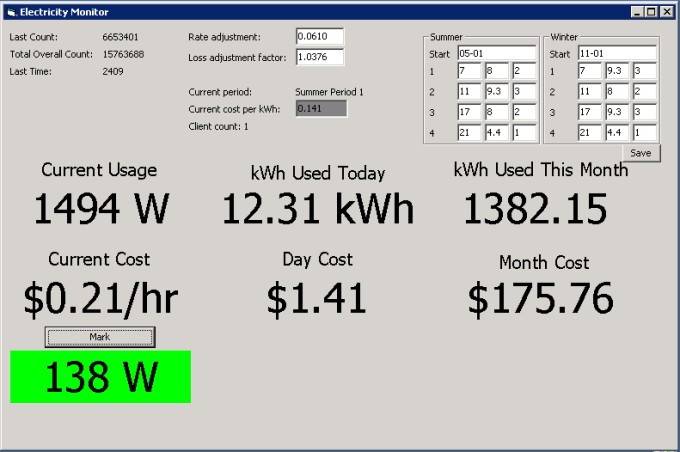
This newer version of the software includes Time-Of-Use billing, whereby my utility company charges me different rates based on the time of day, and whether it is winter or summer. The table of numbers on the right lets me enter those values.
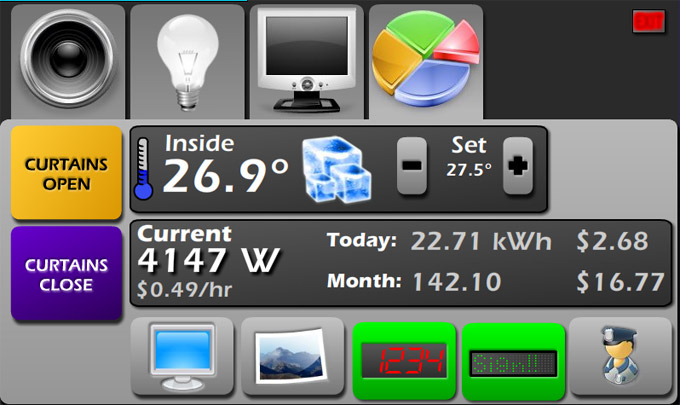
Anyway, this data is transferred over the network to other places. One such place is my swing-arm Touchscreen, where it is displayed live on-screen:
Putting the data to use
Instant load information is nice to have, but not particularly useful. So the next step was taking some of this information and turning it into a chart.Click to enlarge the chart
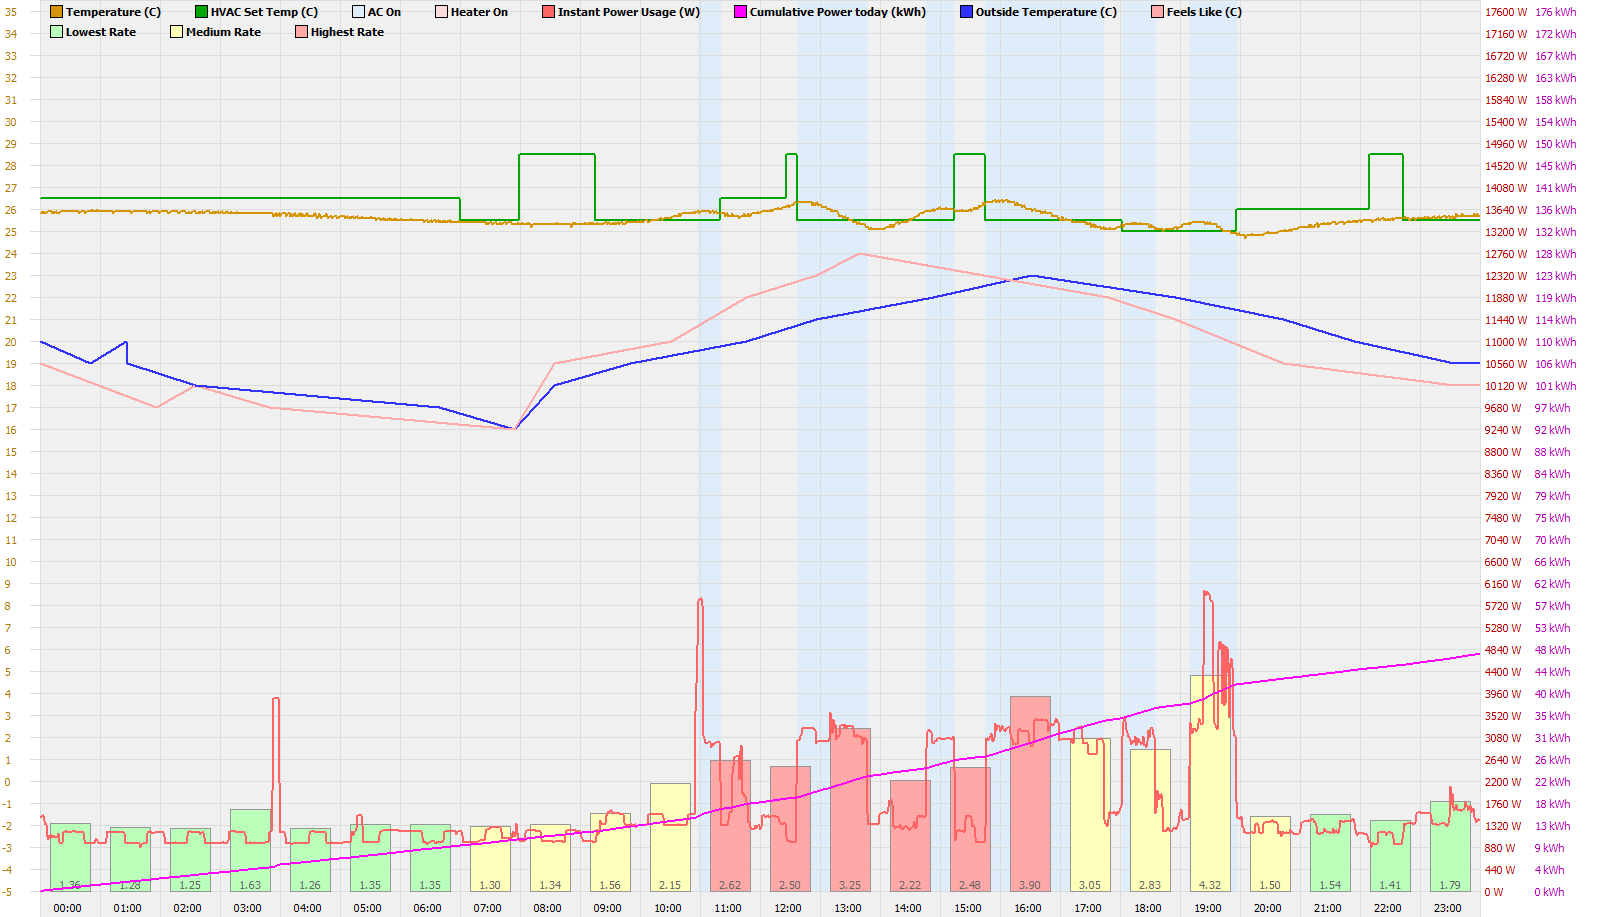
This chart plots the following data:
- Instant power usage (red line) - How much power I was using just then.
- Cumulative power usage (magenta line) - How much power I used in total as the day progressed.
- Power used per hour (hourly bar graph) - The total power used for that hour
- Time of use rates (red/green/yellow bars) - Green bars are the cheapest, yellow are mid, and red are on-peak bars.
- Interior temperature (brown line) - The temperature in my home.
- Exterior temperature (blue line) - The temperature reported by the weather service for Toronto
- Exterior 'feels like' (light pink line) - The 'Feels like' temperature reported by the weather service (windchill / humidex)
- HVAC 'Set' temperature (green line) - The temperature that the heater/AC is 'set' to. This goes up and down as I come and go throughout the day.
- AC 'On' status (light blue blocks) - These blocks represent the air conditioning being ON for that period.
- Heater 'On' status (light pink blocks, not shown) - These blocks represent that the heater was ON for that period.